
SmartMD (SACKIDMD) is 2 minutes of health update Follow @ Facebook.com/sackidMD or Twitter @ SackidMD. Resource from Dr. Prakasam's SACKID group.
Showing posts with label diabetes. Show all posts
Showing posts with label diabetes. Show all posts
Sunday, June 3, 2012


Monday, May 28, 2012
Dead in Bed Syndrome - Part II - How to prevent?
1. Checking a nighttime glucose value will give you an impression of the risk of hypoglycemia.
2. If you use pen injectors, make sure the pen for your bedtime insulin looks and feels quite different from the one you use for daytime meal doses (not just another color that may be difficult to observe in the dark).
3. If you use syringes and vials, store daytime and bedtime insulin in different places. When mixing insulin, be extra careful not to take the often higher bedtime dose of the wrong type.
4. For physically active persons, it is important to check for late hypoglycemia after the exercise, particularly in the night. Remember to decrease the bedtime dose after more strenous exercise, especially if you do not exercise regularly. If you have problems with nighttime hypoglycemia, ask your diabetes team for a continuous glucose monitoring device that may help you to detect nighttime glycemia patterns and adjust your insulin doses to avoid this.
5. HbA1c targets may need to be relaxed in persons with hypoglycemia unawareness to allow this awareness to recover. Aim for a slightly higher average blood glucose. Above all, you should avoid a blood glucose level that is lower than 65-70 mg/dl (3.5-4.0 mmol/l). Within a fortnight (two weeks), you are likely to find you can recognize symptoms of hypoglycemia more easily.
There is one pump (Medtronic Veo), so far available only on the European market, which shuts off the basal rate for two hours when the blood glucose goes below a certain threshold, thereby hopefully avoiding a further decline in blood glucose. This feature is called Low Glucose Suspend (LGS).
References
- Tattersall RB, Gill GV. Unexplained death of type-1 diabetic patients. Diabetic Med 1991;8:49-58.
- Thordarsson H, Sovik O. Dead in ded syndrome in young diabetic patients in Norway. Diabetic Med 1995;12:782-7.
- Sartor G, Dahlquist G. Short-term mortality in childhood onset insulin-dependent diabetes mellitus: a high frequency of unexpected deaths in bed. Diabetic Med 1995;12:607-11.
- Sovik O, Thordarson H. Dead-in-bed syndrome in young diabetic patients. Diabetes Care 1999;22 Suppl 2:B40-2.
- Gormsen H, Lund A. The diagnostic value of postmortem blood glucose determinations in cases of diabetes mellitus. Forensic Sci Internat 1985;28:103-07.
- Tanenberg RJ, Newton CA, Drake AJ. Confirmation of hypoglycemia in the "dead-in-bed" syndrome, as captured by a retrospective continuous glucose monitoring system. Endocr Pract 2010;16:244-8.
- Buckingham B, Wilson DM, Lecher T, Hanas R, Kaiserman K, Cameron F. Duration of nocturnal hypoglycemia before seizures. Diabetes Care 2008;31:2110-2. Free full text available in HTML and PDF formats.
- Weston PJ, Gill GV. Is undetected autonomic dysfunction responsible for sudden death in Type 1 diabetes mellitus? The 'dead in bed' syndrome revisited. Diabet Med 1999;16:626-31.
- Tu E, Twigg SM, Semsarian C. Sudden death in type 1 diabetes: the mystery of the 'dead in bed' syndrome. Int J Cardiol 2010;138:91-3.
- Cryer P. Perspectives in Diabetes. Hypoglycemia begets hypoglycemia in IDDM. Diabetes 1993;42:1691-93.
- Ludvigsson J, Hanas R, Ter Veer A, Andreasson C, Isacson E, Johansson E. Repeated use of continuous glucose monitoring in children and adolescents improved metabolic control without increasing hypoglycemia. Diabetologia 2001;44(suppl 1):A239 (abstract).
- Hanas R. Dead-in-bed syndrome in diabetes and hypoglycaemic unawareness. Lancet 1997;350:493-2 (letter). Reply: Lancet 1997;305:1032-33.
- Fanelli CG, Epifano L, Rambotti AM, Pampanelli S, DiVincenzo A, Modarelli F, Lepore M, Annibale B, Ciofetta M, Bottini P, Porcellati F, Scionti L, Santeusanio F, Brunetti P, Bolli GB. Meticulous prevention of hypoglycemia (near-)normalizes the glycemic thresholds and magnitude of most neuroendocrine responses to, symptoms of and cognitive function during hypoglycemia in intensively treated patients with short-term IDDM. Diabetes 1993;42:1683-89.
- Choudhary P, Evans M, Hammond P, Shaw J, Pickup J, Amiel S. First clinical use of automated glucose suspension during hypoglycaemia: Results of a user evaluation study. ATTD (abstract) 2010.
Ragnar Hanas, MD
January 16, 2011
January 16, 2011
Sunday, May 27, 2012
Dead in Bed Syndrome - Part I
Someone with type 1 diabetes is found dead in the morning in an undisturbed bed after having been observed in apparently good health the day before. No cause of death can be established. This is the typical situation of the "dead in bed" syndrome, a very tragic outcome which leaves the family with many unanswered questions: Why, when, how, could it have been avoided?
After the first report from UK1 the observations have been confirmed from other countries.2,3 A number of young people with type 1 diabetes have been found dead in the morning without previous symptoms of illness, hyper- or hypoglycemia. The number of deaths of this kind per 10,000 patient years has been estimated to 2-6.4 For a population of 100,000 persons with diabetes, this represents 20-60 deaths per year or approximately 6% of all deaths in persons with diabetes aged less than 40 years.4 A relationship to human insulin1 or intensive insulin treatment2 has been postulated but does not seem likely.4 Autopsies have not revealed the cause of death. The diagnosis of hypoglycemia is difficult to confirm after death.5 There is however one case report where the person who died was wearing a retrospective (non-real-time) sensor, and the sensor reading demonstrated levels below 30 mg/dl (1.7 mmol/l) around the time of death (restrictions on reading glucose levels <40 mg/dl, 2.2 mmol/l, were removed by sensor manufacturer after the event), with at least 3 hours of severe hypoglycemia below <40 mg/dl, 2.2 mmol/l, before death.6 Another report using sensor tracings has shown a lag time of 2-4 hours before the onset of seizures when having severe hypoglycemia.7
In a recent review, clinical reports strongly suggest that nighttime hypoglycemia is a likely prerequisite of the event, but that the death is sudden and probably caused by cardiac arrhythmia.8 Genetic predisposition to a so called long QT syndrome can put the person with diabetes at risk of a fatal arrhythmia.9 It is postulated that early signs of nerve damage (autonomic neuropathy) can result in a disturbance of the autonomic nervous system, thereby further increasing the risk.
If it is caused by severe hypoglycemia, why doesn't the person wake up? There has been an increased concern about the phenomenon of hypoglycemic unawareness, which is defined as a hypoglycemic episode without warning symptoms of the decreasing blood glucose level. Increasing evidence has been shown that hypoglycemic episodes as such precede the development of hypoglycemic unawareness.10 Hypoglycemic unawareness will increase the risk of having a severe hypoglycemia.10
We know from recent studies with continuous glucose monitoring11 that nighttime low glucose values are much more common than previously thought. Most often, this is quite asymptomatic and the person does not wake up with hypoglycemic symptoms. Often the glucose value returns to normal or even high in the morning (so called Somogyi phenomenon) so this pattern is difficult to discover without taking nighttime tests every now and then.
Taking the wrong type of insulin before going to bed can contribute to severe nighttime hypoglycemia. We know this has accidentally happened to many young persons with diabetes.12 If a large dose of bedtime insulin (not uncommon in puberty/prepuberty) is replaced with a similar dose of regular or rapid-acting insulin, this will lower the blood glucose considerably and could presumably trigger a severe hypoglycemic reaction which in turn could be further complicated by cardiac arrythmia.
References
- Tattersall RB, Gill GV. Unexplained death of type-1 diabetic patients. Diabetic Med 1991;8:49-58.
- Thordarsson H, Sovik O. Dead in ded syndrome in young diabetic patients in Norway. Diabetic Med 1995;12:782-7.
- Sartor G, Dahlquist G. Short-term mortality in childhood onset insulin-dependent diabetes mellitus: a high frequency of unexpected deaths in bed. Diabetic Med 1995;12:607-11.
- Sovik O, Thordarson H. Dead-in-bed syndrome in young diabetic patients. Diabetes Care 1999;22 Suppl 2:B40-2.
- Gormsen H, Lund A. The diagnostic value of postmortem blood glucose determinations in cases of diabetes mellitus. Forensic Sci Internat 1985;28:103-07.
- Tanenberg RJ, Newton CA, Drake AJ. Confirmation of hypoglycemia in the "dead-in-bed" syndrome, as captured by a retrospective continuous glucose monitoring system. Endocr Pract 2010;16:244-8.
- Buckingham B, Wilson DM, Lecher T, Hanas R, Kaiserman K, Cameron F. Duration of nocturnal hypoglycemia before seizures. Diabetes Care 2008;31:2110-2. Free full text available in HTML and PDF formats.
- Weston PJ, Gill GV. Is undetected autonomic dysfunction responsible for sudden death in Type 1 diabetes mellitus? The 'dead in bed' syndrome revisited. Diabet Med 1999;16:626-31.
- Tu E, Twigg SM, Semsarian C. Sudden death in type 1 diabetes: the mystery of the 'dead in bed' syndrome. Int J Cardiol 2010;138:91-3.
- Cryer P. Perspectives in Diabetes. Hypoglycemia begets hypoglycemia in IDDM. Diabetes 1993;42:1691-93.
- Ludvigsson J, Hanas R, Ter Veer A, Andreasson C, Isacson E, Johansson E. Repeated use of continuous glucose monitoring in children and adolescents improved metabolic control without increasing hypoglycemia. Diabetologia 2001;44(suppl 1):A239 (abstract).
- Hanas R. Dead-in-bed syndrome in diabetes and hypoglycaemic unawareness. Lancet 1997;350:493-2 (letter). Reply: Lancet 1997;305:1032-33.
- Fanelli CG, Epifano L, Rambotti AM, Pampanelli S, DiVincenzo A, Modarelli F, Lepore M, Annibale B, Ciofetta M, Bottini P, Porcellati F, Scionti L, Santeusanio F, Brunetti P, Bolli GB. Meticulous prevention of hypoglycemia (near-)normalizes the glycemic thresholds and magnitude of most neuroendocrine responses to, symptoms of and cognitive function during hypoglycemia in intensively treated patients with short-term IDDM. Diabetes 1993;42:1683-89.
- Choudhary P, Evans M, Hammond P, Shaw J, Pickup J, Amiel S. First clinical use of automated glucose suspension during hypoglycaemia: Results of a user evaluation study. ATTD (abstract) 2010.
Ragnar Hanas, MD
January 16, 2011
January 16, 2011
Sunday, April 15, 2012
BLOOD GLUCOSE TEST STRIPS - Problems and fixes!! PART III
Methods of electrochemical analysis
All EBGTS (Electrochemical blood glucose test strips) produce a time varying current which must be analyzed to deduce a glucose concentration.However, the method of analysis varies substantially, depending upon the strip design.
In the broadest sense, the analysis can be either
1. amperometric, in which the instantaneous current at a particular time is proportional to glucose, or
2. coulometric, in which the integrated charge underneath the entire curve is proportional to glucose.
Amperometric strips predominate among electrochemical test strips. Typically the current is measured 5-15 seconds after the strip is filled with blood, and that current level is directly proportional to the glucose concentration. There are, however, many variations on this theme. For example:
- Current can be measured and averaged over a short (a few seconds) interval.
- Peak current can be measured.
- A mathematical analysis of the declining portion of the current-time curve (termed a Cottrell analysis) can be performed.
In general, strips designed for amperometric analysis share some features:
- The surface area and surface roughness of the working electrode must be highly reproducible to insure that current-time curves are reproducible from strip to strip.
- The electrode surface-area/sample-volume ratio is low, so that glucose is not substantially depleted in the strip during the analysis.
Enzymes used in the strips
 | ||
| Table I. Commonly used enzymes for EBGTS | ||
| ||
| Enzyme | Reacts with O2? | Reacts with maltose? |
| ||
| Glucose Oxidase | Yes | No |
| PQQ-Glucose Dehydrogenase | No | Yes |
| NAD-Glucose Dehydrogenase | No | No |
| FAD-Glucose Dehydrogenase | No | No |
| ||
Four enzymes are commonly used in these strips
Glucose oxidase was first employed in EBGTS, and is still used in a few commercially available test strips, although its use is declining, since it reacts rapidly with oxygen. EBGTS made with glucose oxidase produce currents that are dependent on the amount of dissolved oxygen in the blood sample, which is heavily dependent on the hematocrit (% red blood cells) in the sample.
Glucose oxidase has been largely supplanted by the dehydrogenases, which do not react appreciably with oxygen. (In the table above: PQQ, NAD, and FAD refer to the electron transferring cofactors, which differ between each of the distinct enzymes.) However PQQ-GDH does react with many non-glucose sugars, particularly maltose, which can be elevated in patients undergoing peritoneal dialysis. For this reason, use of PQQ-GDH is decreasing, and the FDA has recently restricted its use in new commercial products.
Both NAD-GDH and FAD-GDH combine oxygen rejection with high specificity for glucose. Their use in EBGTS is increasing. Enzymes typically are deposited on at least the working electrode, and sometimes on one entire side of the sample chamber, and are codeposited with buffers and stabilizing agents, such as bovine serum albumin.
Copied by permission from the "Electrochemistry Dictionary" (http://electrochem.cwru.edu/ed/dict.htm) on "04/09/12." The original material is subject to periodical changes and updates.
Saturday, April 14, 2012
BLOOD GLUCOSE TEST STRIPS - PART II - The EBGTS story!
Electrochemical blood glucose test strips (EBGTS)
The electrochemical blood glucose test strip (EBGTS) is a very small volume (often about one µl or less) disposable electrochemical cell, which is contacted with whole blood. It then produces, in conjunction with a test meter, an electrical current which is proportional to the blood glucose concentration. Typical currents are a few µA.
This electrical current is produced by the very selective oxidation of glucose in the blood sample, which is catalyzed by two reagents which are precoated inside the test strip:
(i) an enzyme, which reacts directly with the glucose molecule to remove its two available electrons, and
(ii) a mediator molecule, which takes (either singly or as a pair) the two electrons from the enzyme, and transports them to the working electrode, where they can be measured.
This process is illustrated in Figure below.

The enzyme and mediator act as a sort of electron bucket brigade to transport electrons from glucose to the working electrode. Each enzyme and mediator molecule can repeat this transfer again and again, if necessary. There are a wide variety of different enzymes and mediators which are suitable for use in an EBGTS. Although there are many differences between the various commercially available test strips, they all rely on the fundamental mechanism
Copied by permission from the "Electrochemistry Dictionary" (http://electrochem.cwru.edu/ed/dict.htm) on "04/09/12." The original material is subject to periodical changes and updates.
Friday, April 13, 2012
BLOOD GLUCOSE TEST STRIPS - How do they work? PART I
- Insert a disposable test strip into the meter, automatically turning the meter on.
- Lance the skin with a fine sharp to produce a small blood droplet, about one mm in diameter (volume = 0.3 to 5 µl)
- Sample the blood with the test strip, attached to the meter.
- The meter interrogates the strip in order to measure the blood glucose concentration, typically requiring about 5-10 seconds.
The test strips described in the above procedure can be either optical, in which glucose-derived electrons effect a change in the color of an indicating dye molecule, or electrochemical, in which case the glucose-derived electrons are routed directly through the external meter, and counted. For various reasons, including accuracy and the ability to measure extremely small blood volumes, electrochemical strips have gained the advantage in recent years, and now comprise a growing majority of the test strip market.


Components of a test strip
Automatic coding
Generally, calibration codes, corresponding to a particular batch of strips, are entered into the meter by the user, either manually or through insertion of a calibration “chip,” that accompanies the strip vial. However, it is desirable to entirely bypass this process, since user error is always a possibility. Therefore, some EBGTS do not require calibration of any sort. This is generally accomplished by:- Precise manufacturing control of the sensitivity of the produced strips, such that their performance is highly reproducible from batch to batch. In this process, strips are rejected, and disposed of, if their performance does not meet very stringent performance criteria.
- Adding an indicating mark to the strip that the meter can use to assign a calibration code.
Copied by permission from the "Electrochemistry Dictionary" (http://electrochem.cwru.edu/ed/dict.htm) on "04/09/12." The original material is subject to periodical changes and updates.
Tomorrow we will discuss about the Electrochemical blood glucose test strips (EBGTS) - The newest and commonest type of strips used today
Thursday, March 15, 2012
HbA1c and Estimated Average Glucose (eAG)
Source of this information: ADA and http://www.ngsp.org/A1ceAG.asp
There is a very predictable relationship between HbA1c and AG.
Understanding this relationship can help patients with diabetes and their health-care providers set day-to-day targets for AG based on HbA1c goals
Fasting glucose should be used with caution as a surrogate measure of AG.
Finally, it is important to remember that HbA1c is a weighted average of glucose levels during the preceding 4 months. Unless the patient’s glucose levels are very stable month after month, quarterly measurement is needed to insure that a patient's glycemic control remains within the target range.
How does HbA1c relate to average glucose (AG)?
In the Diabetes Control and Complications Trial or DCCT (New Engl J Med 1993;329:977-986) study of patients with Type 1 diabetes, quarterly HbA1c determinations were the principal measure of glycemic control; study subjects also performed quarterly 24-hour, 7-point capillary-blood glucose profiles.
Blood specimens were obtained by subjects in the home setting, pre-meal, 90 minutes post-meal, and at bed-time. In an analysis of the DCCT glucose profile data (Diabetes Care 25:275-278, 2002), mean HbA1c and AG were calculated for each study subject (n= 1439). Results showed a linear relationship between HbA1c and AG
(AG(mg/dL) = ( 35.6 x HbA1c ) - 77.3), with a Pearson correlation coefficient (r) of 0.82.
CALCULATOR: The following link will help to do the Estimated Average Glucose Calculation
http://professional.diabetes.org/GlucoseCalculator.aspx :
HbA1c (%)
|
eAG (mg/dL)
|
eAG (mmol/l)
|
5
|
97
|
5.4
|
6
|
126
|
7.0
|
7
|
154
|
8.6
|
8
|
183
|
10.2
|
9
|
212
|
11.8
|
10
|
240
|
13.4
|
11
|
269
|
14.9
|
12
|
298
|
16.5
|
Wednesday, March 14, 2012
HbA1C - The new way of measuring it - IN future!!
There have been multiple attempts in Global Standarizations and consensus statements have been issued, but very difficult to implement.
In the US we still follow HbA1c in % and eAG ( estimated average glucose) is just catching up.
US guidelines developed based on he National Glycohemoglobin Standardization Program (NGSP)
Two major measurement criteria: International Federation of Clinical Chemistry (IFCC) units vs NGSP
The International Diabetes Federation and American College of Endocrinology recommend HbA1c values below 48 mmol/mol (6.5%), while American Diabetes Association recommends that the HbA1c be below 53 mmol/mol (7.0%) for most patients.[
In the US we still follow HbA1c in % and eAG ( estimated average glucose) is just catching up.
US guidelines developed based on he National Glycohemoglobin Standardization Program (NGSP)
Two major measurement criteria: International Federation of Clinical Chemistry (IFCC) units vs NGSP
| IFCC-HbA1c | DCCT- HbA1c | Mono S- HbA1c |
|---|---|---|
| (mmol/mol) | (%) | (%) |
| 10 | 3.1 | 2.0 |
| 20 | 4.0 | 2.9 |
| 30 | 4.9 | 3.9 |
| 40 | 5.8 | 4.8 |
| 45 | 6.3 | 5.3 |
| 50 | 6.7 | 5.8 |
| 55 | 7.2 | 6.3 |
| 60 | 7.6 | 6.8 |
| 65 | 8.1 | 7.2 |
| 70 | 8.6 | 7.7 |
| 80 | 9.5 | 8.7 |
| 90 | 10.4 | 9.6 |
| 100 | 11.3 | 10.6 |
2010 Consensus Statement on the Worldwide Standardization of HbA1c
The recommendations are:
- HbA1c test results should be standardized worldwide, including the reference system and results reporting.
- The IFCC reference system for HbA1c represents the only valid anchor to implement standardisation of the measurement.
- HbA1c results are to be reported by clinical laboratories worldwide in SI (Système International) units (mmol/mol – no decimals) and derived NGSP units (% - one decimal), using the IFCC-NGSP master equation (DCCT units).
- HbA1c conversion tables including both SI (IFCC) and NGSP units should be easily accessible to the diabetes community.
- Editors of journals and other printed material are strongly recommended to require that submitted manuscripts report HbA1c in both SI (IFCC) and NGSP/DCCT units.
- The reportable term for glycated hemoglobin is HbA1c, although other abbreviations may be used in guidelines and educational material (A1C).
Tuesday, March 13, 2012
History of HbA1c and what does it do?
History:
Hemoglobin A1c was first separated from other forms of hemoglobin by Huisman and Meyering in 1958. It was first characterized as a glycoprotein by Bookchin and Gallop in 1968. Its increase in diabetes was first described in 1969 by Samuel Rahbar The use of hemoglobin A1c for monitoring the degree of control of glucose metabolism in diabetic patients was proposed in 1976 by Anthony Cerami, Ronald Koenig and coworkers.
 N-linked protein glycosylation (N-glycosylation of N-glycans) at Asn residues (Asn-x-Ser/Thr motifs) in glycoproteins.
What are Glycoproteins?
They are proteins that contain oligosaccharide chains (glycans) covalently attached to polypeptide side-chains. The carbohydrate is attached to the protein in a cotranslational orposttranslational modification. This process is known as glycosylation. In proteins that have segments extending extracellularly, the extracellular segments are often glycosylated. Glycoproteins are often important integral membrane proteins, where they play a role in cell–cell interactions. Glycoproteins are also formed in the cytosol, but their functions and the pathways producing these modifications in this compartment are less well understood
Why do we measure HbA1c every 3 months?

Hemoglobin A1c was first separated from other forms of hemoglobin by Huisman and Meyering in 1958. It was first characterized as a glycoprotein by Bookchin and Gallop in 1968. Its increase in diabetes was first described in 1969 by Samuel Rahbar The use of hemoglobin A1c for monitoring the degree of control of glucose metabolism in diabetic patients was proposed in 1976 by Anthony Cerami, Ronald Koenig and coworkers.
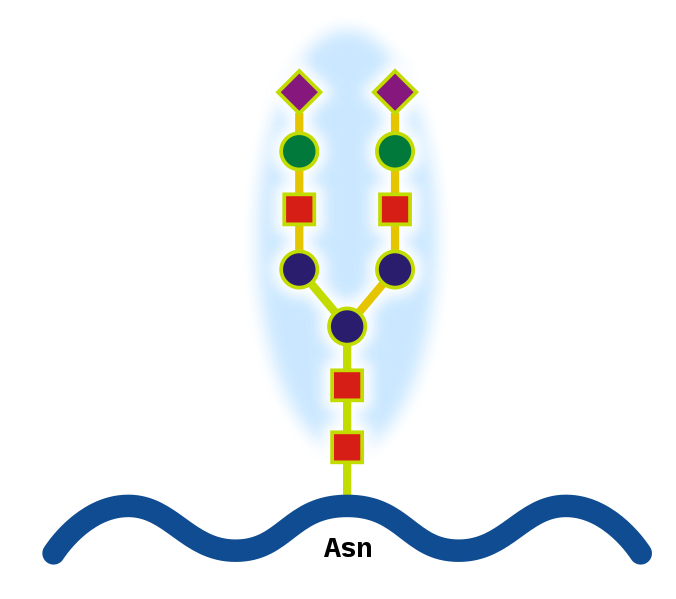
What are Glycoproteins?
They are proteins that contain oligosaccharide chains (glycans) covalently attached to polypeptide side-chains. The carbohydrate is attached to the protein in a cotranslational orposttranslational modification. This process is known as glycosylation. In proteins that have segments extending extracellularly, the extracellular segments are often glycosylated. Glycoproteins are often important integral membrane proteins, where they play a role in cell–cell interactions. Glycoproteins are also formed in the cytosol, but their functions and the pathways producing these modifications in this compartment are less well understood
Why do we measure HbA1c every 3 months?
In the normal 120-day lifespan of the red blood cell, glucose molecules react with hemoglobin, forming glycosolated hemoglobin. In individuals with poorly controlled diabetes, the quantities of these glycosolated hemoglobins are much higher than in healthy people.
Once a hemoglobin molecule is glycosolated, it remains that way. A buildup of glycosolated hemoglobin within the red cell, therefore, reflects the average level of glucose to which the cell has been exposed during its life-cycle. Measuring glycosolated hemoglobin assesses the effectiveness of therapy by monitoring long-term serum glucose regulation. The HbA1c level is proportional to average blood glucose concentration over the previous four weeks to three months. Some researchers state that the major proportion of its value is related to a rather shorter period of two to four weeks.

Image source: http://adiscar-adiscar.blogspot.com
We will talk about measuring HbA1c tomorrow
Subscribe to:
Posts (Atom)